I recently stumbled upon a very interesting infographic that I think captures the current state of the cryptocurrency world very well. The infographic was published by
Forexnewsnow and captures some of the important statistics about the world of cryptocurrency today.
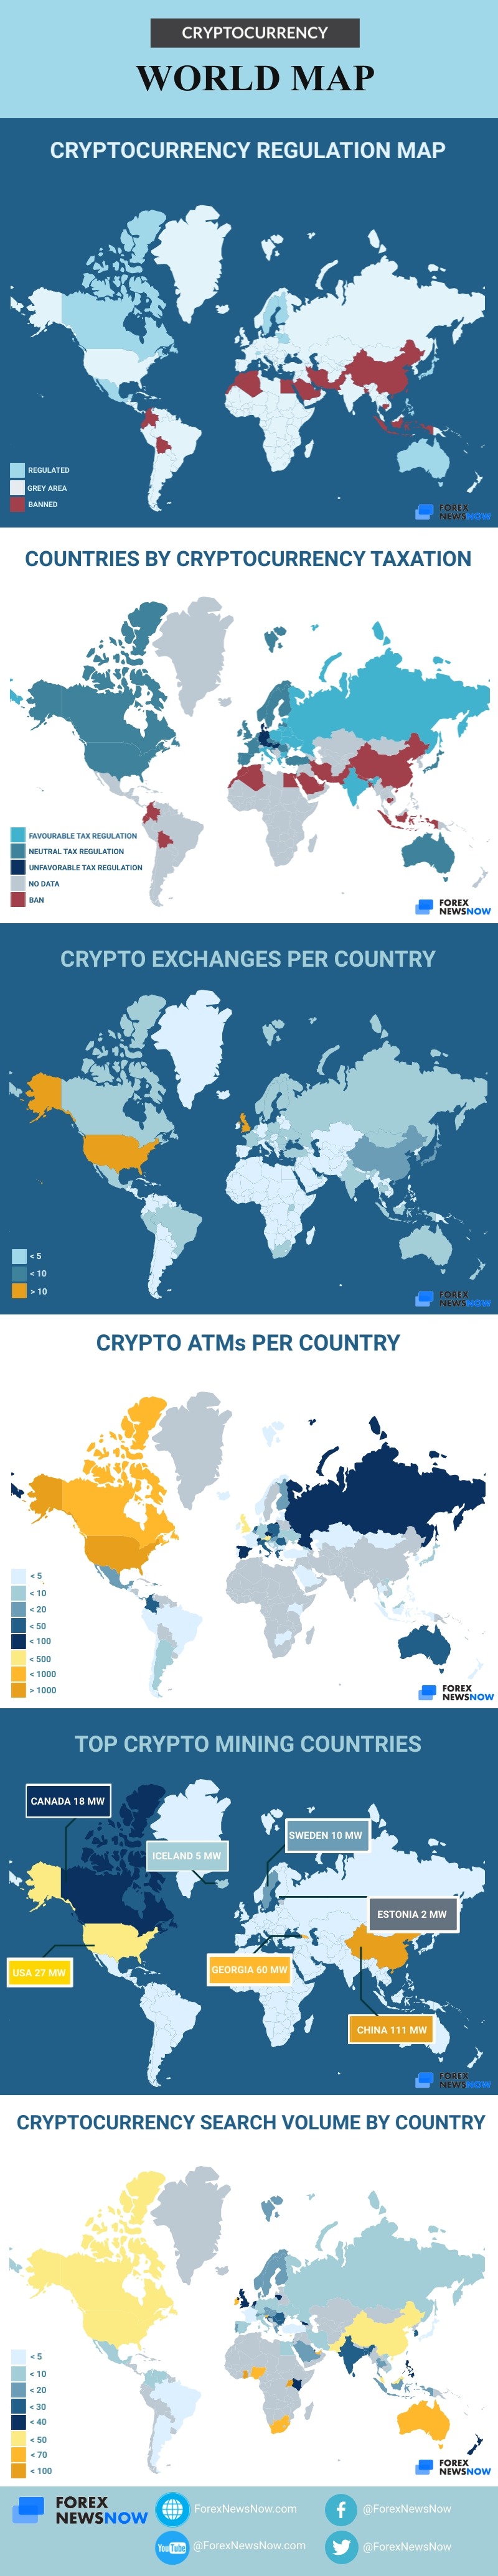
Cryptocurrency regulation map
The first map on the infographic is the cryptocurrency regulation map, which is a rather simple, but important aspect of the crypto industry that people should be considering. Simply taking a look at the map would allow an average person to see how conflicted
the world is about cryptocurrencies, still. The majority of the world remains in the gray about it, but the number of countries that have banned it and the type of these countries speaks volumes to the potential of the currency. The
countries that regulate cryptos tend to be a little free market-oriented and socially liberal.
Taxation Map
While the world is mostly undecided as of to the future of cryptos, the governments of the majority of the biggest powers know their attitude to how they want the money to be treated in relation to taxation. While the countries that have banned it do not
tax it either, there is a significant range of differences between those countries that tax cryptos favorably and unfavorably. This kind of data might inform your future decision about whether you want to keep your cryptos in those countries or not.
Number of exchanges
A significant identifier of whether cryptos are being accepted in a certain country or not is the number of exchanges contained within each. Although, the world falls way behind the United States in this battle, as the US has more than ten crypto exchanges,
while the rest of the world struggles to compare. There might not be that many reasons for this, other than the fact that the US residents love themselves a good opportunity to trade.
ATMs per country
In this case, we are not talking about normal ATMs. We are talking about crypto ATMs. These little machines are the perfect opportunity to make it the traders’ lives easier. They are most prevalent in the areas where crypto trade is easiest and taxation
is friendliest. Which is why you are seeing most of these
ATMs in the US. But you will have also noticed that they are becoming more and more prevalent across the world - the trend follows those who trade crypto. This is why this data could even be used in your attempts to recognize where and how many people are
actually trading cryptos around the world, right now.
Mining by country
This is seemingly the stat that is most bewildering. The country where cryptocurrencies are banned spends the most electricity on mining, which seems to be a violation of their own laws. What seems even stranger is the fact that the second most zealous country
in the world, in terms of electricity spent mining, is a tiny country on the eastern edge of Europe, known as Georgia. The map is sort of all over the place, and it is sort of hard to understand for those who are unaware of what drives crypt trading. The reality
of the matter is that crypto mining follows the cheapest prices in electricity consumption, which is why countries like Georgia, China, and Iceland are all on the list. Some of these are subsidized by the government, while others simply have cheap electricity
available to them year round. This is where the industrial miners congregate.